CJC-F, CJC-F Announcements
Technologies in Drug Abuse Testing
The Power of Science and Technology
Did you know? There was a time, back in the 1800s, when drugs in Singapore were both accepted and normalized. Opium was a popular drug at that time among Chinese immigrants of various social classes. It was not only a form of solace and panacea to the poor but also a status symbol to the wealthy. Singapore at that time was a thriving opium distribution centre in Asia.
Over the years, many new kinds of drugs such as heroin and morphine began to emerge in the market. This phenomenon sparked the country’s ‘war on drugs’ between the authorities and drug users.
Technological Advancements
Unlike in the past, the science and technologies of today provide the authorities with an advantage when it comes to identifying and quantifying drugs either consumed or processed by individuals. The instruments available are able to detect extremely trace amount of drugs present in any sample, leaving no room for exclusion among those who consume drugs. Biological samples such as blood, hair and urine are the most usual avenues to document drug exposure in individuals.
Basic Testing Procedure
With the help of the police, samples collected will be sent for testing. However, prior to detection and sample analysis via the instruments, the collected samples must first be prepared into a suitable medium. The two most common analytical instruments used by HSA and many other agencies are the Liquid Chromatography (LC) and Gas Chromatography-Mass Spectrometry instruments.
There are three main steps to the preparation of samples: Sample Preservation, Sample Preparation and Sample Extraction.
1. Sample Preservation
Biological samples documenting drug exposure can degrade over time. Hence, sample preservation is necessary when they are not tested immediately. A general approach to sample preservation via storage would be to refrigerate them after collection.
The time period where drug analytes can remain inside the urine depends on several factors. These include the type and dose of drugs ingested, individual metabolism rate and amount of water intake. Therefore, in order to extend the half-lives of the drug analytes inside urine samples, sample preservation techniques such as addition of preservatives, adjusting pH levels, filtration prior to storage, sample storage conditions and temperature (~4℃) can be utilised.
2. Sample Preparation
Sample preparation involves transforming the sample from its original state into a medium that is suitable for instrumental analysis. This is an essential step because very often, samples obtained are in dirty matrices that require cleaning-up or they exist in forms that are not suitable for detection. For example, non-biological samples such as drugs in tablet or powdered form, they have to be dissolved into solution so that they can be injected for analysis. Other more technical steps include performing enzyme hydrolysis to biological samples. This is because when drugs of abuse are consumed, some of them may be metabolised inside the human body resulting in the formation of glucuronide which cannot be detected by LC or GCMS. Hence, the subsequent enzyme hydrolysis step performed is required for breaking down of the glucuronide present and releasing the drugs back into their free forms so that they can be extracted for analysis.
3. Sample Extraction
After the sample is prepared, the next immediate step is to efficiently extract and separate the drug analytes that were inside the sample from the sample’s dirty matrix so that it can be injected into the instrument for analysis. There are many types of sample extraction techniques and the most common one used would be Solid Phase Extraction (SPE). It is an extraction method used for cleaning-up samples and analytes concentration preceding instrumental analysis. The collected sample eluate would be concentrated into smaller volumes for sample analysis. The figure below shows a schematic representation of a standard SPE procedure. 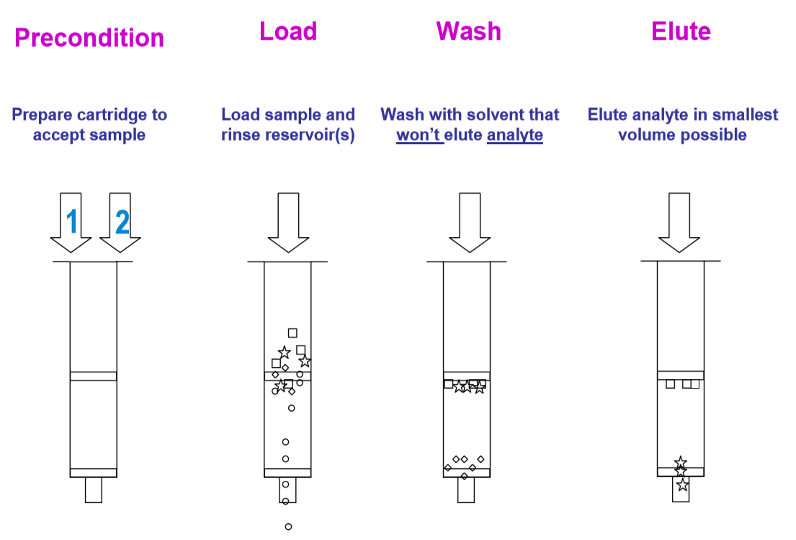
Figure 1: Schematic Representation of a Standard SPE Procedure
Source: https://www.agilent.com/cs/library/eseminars/Public/Secrets%20of%20SPE.pdf
Instrumentation
What is Gas/Liquid Chromatography Mass Spectroscopy (G/LCMS)?
Both GC and LCMS are the two most common analytical instruments used for the detection of drug analytes in samples. As the name suggests, GCMS and LCMS consist of two main components – Gas Chromatography (GC) / or Liquid Chromatography (LC) and Mass Spectroscopy (MS). This is an advanced analytical instrumental technique that combines the physical separation capabilities of a GC/LC with the mass analysis capabilities of MS. It is a very sensitive instrument that can be used for trace level detection. It can be used to separate, identify and quantitate the analytes of interest present in any sample that can be dissolved in a liquid.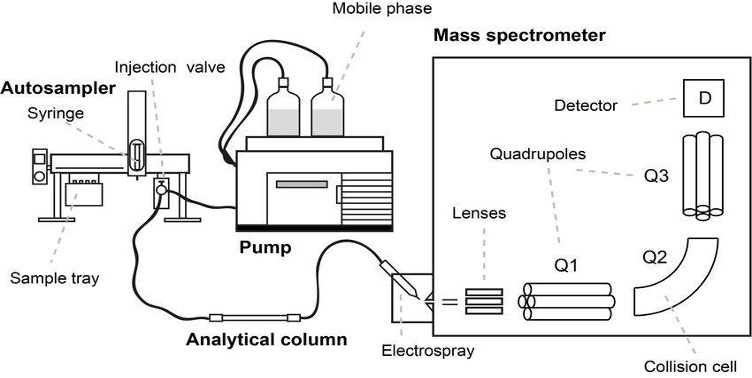
Figure 2. Schematic Representation of the G/LCMS (top) and a LCMS machine (bottom)
Source (Top): https://www.researchgate.net/profile/Marcus_Oestman/publication/328980854/figure/fig7/AS:693506003714050@1542356124904/Schematic-overview-of-a-LC-MS-MS-system-with-a-triple-quadrupole-mass-analyzer_W640.jpg
Source (Bottom): https://www.google.com/url?sa=i&url=https%3A%2F%2Fwww.waters.com%2Fwaters%2Fen_US%2FMost-sensitive-mass-spectrometer-for-LC-MS-MS-in-the-clinical-laboratory%2Fnav.htm%3Flocale%3Den_US%26cid%3D134831529&psig=AOvVaw34eERkBrhcOfx7oMrui3x6&ust=1613467421731000&source=images&cd=vfe&ved=0CAIQjRxqFwoTCIDV8tbI6-4CFQAAAAAdAAAAABAD
What is Gas/Liquid Chromatography? How does it work?
Chromatography is the general name given the methods by which two or more compounds in a sample mixture are physically separated via distribution among themselves between two phases; a stationary phase, which can be either in the form of a solid or liquid supported on a solid, and a mobile phase, either a gas or a liquid which flows continuously into and interacting with the stationary phase. The separation of the individual components in the sample mixture results from their relative differences in affinity with the stationary phase.
After the separation of the individual components, detection of them in both GC and LC can be made by various means. One of the most common and sensitive instruments used is a mass spectrometer (MS). The MS can be used to detect and record the relative masses and abundances of ions that are produced from the separated giving off structural information for qualification and quantification purposes.
What is Mass Spectroscopy? How does it work?
In general, a mass spectrometer consists of an ion source, a mass-selective analyser and an ion detector. It can be used to quantify known materials (quantitative) and identify unknown compounds (qualitative) within a sample. There are three main steps to how a MS works: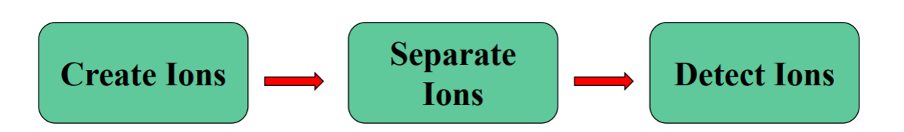
Figure 3. Flowchart of how MS works
Firstly, the molecules of interest are introduced into the ionisation source where they are vaporised, an electrical charge then converts them into gaseous ions (Create Ions). Next, these charged ions travel through a high-vacuum system where they are separated based on their mass-to-charge ratios (m/z) before reaching the detector (Separate ions). Lastly, upon contact with the detector (a microchannel plate or photomultiplier tube), useable signals will be generated and recorded by a computer system, producing the MS chromatogram (Detect Ions).
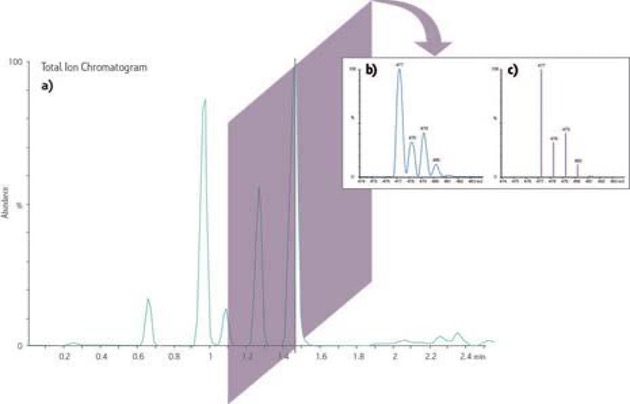
Figure 4. Sample Chromatogram obtained from MS.
a) A representation of an increase in abundance in the total ion current as it changes over time in a chromatographic-like trace.
b) A digital slice of a peak in the Total Ion Chromatogram represents the ions at the specific time making up the ion current often referred to as a profile or continuum acquisition. The ‘x-axis’ is changed from time to mass-to-charge (m/z) and the ability to resolve neighbouring ions in the spectrum (such as isotopes) can be readily seen.
c) The profile mass spectrum from b) is often reduced to a ‘stick plot’ represented by centroids dropped from each peak apex reducing the size of the stored file in favour of the increased resolution information.
Source: https://www.waters.com/waters/en_US/What-is-MS-and-How-does-it-Work%3F/nav.htm?cid=10073253&locale=en_US
Profile Mass Spectrum – (“Fingerprint” Patterns)
Library/Database Comparison
The mass spectrum obtained from the separated compounds in the samples are like “fingerprint” patterns. They are unique to each of the compounds with a specific m/z for each of the separated components. By comparing and cross referencing to chromatograms of drug standards in the stored library/database of the computer system, the unknown compounds present in the samples can be matched and identified.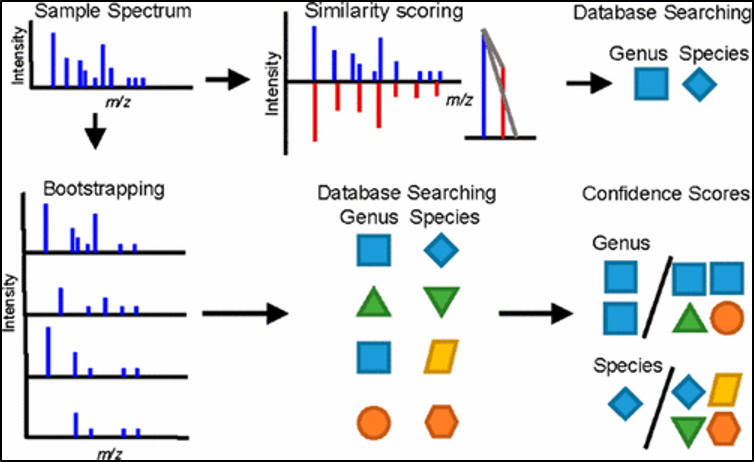
Figure 5. Illustration of the identification process for unknown samples, using sample spectrum.
Source: https://www.x-mol.com/paper/442644
As mentioned in the previous article, some of the drugs undergo metabolism after consumption into the human body. Thus, it is important to have the parent (Original Drug) and daughter (Metabolised Drug) pair for each of these drugs and their respective chromatogram standards identified. This allows us to conclude that the individual might have consumed the drug even when the specific m/z ratio of the parent ion is undetected by the instrument.
Conclusion
Ultimately, there is no hard and fast rule on what conditions are to be used for the separation of the drugs. GCMS and LCMS are currently the two heading instruments used for analytical testing for drugs in labs. However, this may changewith new technological innovations in science. Factors such as the sample matrix, the type of drug components we are separating and the possible solvent effects between the sample and the mobile phase used for separation have to be considered when deciding for the best extraction method to be used. This can be done through the method development and validation stage via conducting various trial runs to optimize the method of extraction and analysis of samples.
*The views and opinions expressed in this article do not constitute legal advice and solely belong to the author and do not reflect the opinions and beliefs of the NUS Criminal Justice Club or its affiliates.
Authors’ Biography
 Celine Cheow is a fourth year Pharmacy student doing a minor in Forensic Science. She is a member of CJC-F, and is passionate about forensics, especially in the area of illicit drug detection. She hopes to be a forensic toxicologist in the future.
 Tay Bo Wen Thomson is a Year 4 Chemistry student in NUS, pursuing a minor in forensic science. He is currently completing his Final Year Internship in the Health Sciences Authority (HSA) of Singapore, working in the Analytical Toxicology Laboratory (Drug Abuse Testing). As one of the project managers of the “Forensics in Drug Offences”, he directs the newsletter publication with his co-managers and guides the team with his scientific knowledge in drugs. Thomson also has great passion in criminology and forensic sciences, aspiring to be a police officer in the Singapore Police Force in the future.
 Muhammad Khairul Fikri is a Year 3 undergraduate from the Faculty of Arts and Social Sciences. Khai is one of the Project Managers of “Drugs & Forensics”. He is pursuing a Major in Geography and two Minors; Forensic Science and Geographical Information Systems. He is interested in the applications of technology, particularly geospatial technologies, in forensic science and crime scene investigations.


